

During most years, the stock market tends to go up in value, 73% of the time since 1928, to be precise.1 Using historical returns as an indicator, in any given year, you’re usually better off investing in ‘the market’ than not investing at all.
Unfortunately, the S&P 500 (often referred to as the ‘the market’), is having one of its worst starts to the year ever and at the time of this writing, the index is down nearly 20% from its January highs.
Logging into your investment accounts in the midst of this market sell off is a painful experience. It can make us wish we could go back in time and sell-out of our investments when we were ahead. However, it takes a seasoned investor to know, that timing the market is incredibly difficult and even the best investors often don’t outperform their benchmarks over time.
It’s a tough pill to swallow in the moment, but market selloffs are the price of admission when you’re an investor. It’s during these times that we’re reminded that risk and reward are always going to be inherently related. However, we can take comfort in what the historical data tells us and know that we will be OK, if we buy for the long term.
So What Is Considered Long Term?
A one-year period in the stock market can be volatile. How volatile? Returns have ranged from the highs of 52.6% (1954) during the economic expansion post World War 2, to the lows of -43.8% (1931) as experienced in the Great Depression. While the average yearly return of the S&P 500 has been 11.8% since 1928.1
On the other end of the spectrum, there has never been a 20-year period where you would have been worse off investing in the market. This includes periods from the Great Depression, Dot-com bubble, and Great Recession.
As investors we’ve been told throughout our life to invest for the long-term. But what is long-term? Perhaps the better question is: over what time periods do the odds shift to favor investors?
What Does the Data Say?
When it comes to managing expectations, most people find comfort in ‘preparing for the worst and hoping for the best’. In order to help our clients prepare for the worst, I aggregated decades of market (S&P 500) data to find out the following:
- What was the probability of experiencing a negative return over various time periods?
- When returns were negative, what was the average drawdown over that period?
- When do the odds become extremely favorable?
Here’s what the data tells us:
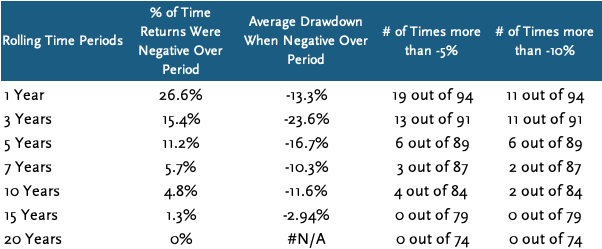
The data points in the table above are helpful, but it’s the trend that is most important. You can see as the time periods increase, the historical probabilities of you losing, go down significantly.
So, when we look at the data, when do the odds begin to favor investors? How about seven years? Over every seven-year period since 1928, about 95% of the time, you were better off being an investor than not. There is also a significant improvement between the 5-year and 7-year periods, where the percentage of time periods when returns were negative dropped from 11.2% to 5.7%. This is a substantial change, where the percentage of the time you would have been worse off, gets cut in half from about a one in ten possibility, to about a one in twenty.
How about ten years? There’s an incremental difference between 7-year periods and 10-year periods, where the percentage of times you were worse off decreases by less than one percent and the average drawdown over the period was actually worse (the data over 5-year periods were skewed by returns during the Great Depression).
However, the most compelling case occurs at the 15-year mark, where 99% of the time you were better off investing in the market. Let me say that again… 99% of the time (yeah, I rounded up).
And, as I mentioned previously, there has never been a 20-year period where you would have lost more than your original investment two decades later. If you’re curious on what it would have been like to invest during those periods, check out the next section.
It’s worth mentioning that there are numerous ways to diversify risk (bonds, cash, alternatives, etc.) and we know risk appetite is unique to everyone, but perhaps the next time you think about investing, you should think about these time ranges for how long you should be willing to see your investments through.
What if you invested $100k during the Great Depression and 2000’s?
Here’s what it would’ve looked like if you invested during the Great Depression and during the worst 20-year period in the 2000’s, which included the Dot-Com bubble and Great Recession. Years with negative returns are highlighted in red.
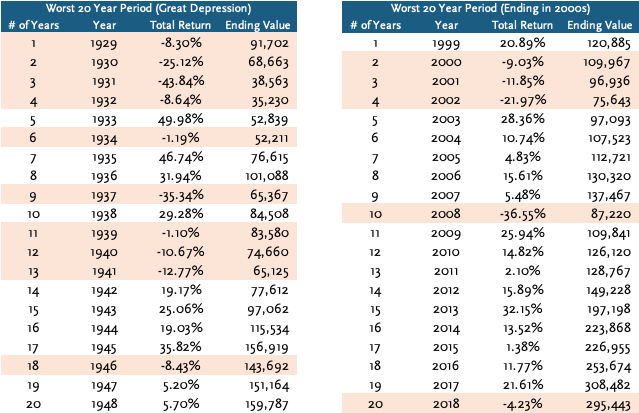
Even with numerous years of hard losses, by the end of both 20-year periods, you’d still come out further ahead than when you started. Even in the worst 20-year period in the 2000’s, you still would have almost tripled your original investment.
The Glass Half Full
Now, here is the cherry on top, the data referenced throughout this post assumes you invested a lump-sum and never made another investment along the way. If you’re fortunate enough to have the ability to continue buying into the market during a sell off, whether that’s through 401k contributions, a recurring savings plan, or even haphazardly when you get an influx of cash to invest, the continuous purchase of assets at lower prices will significantly help your long-term returns!
Market selloffs often present amazing buying opportunities. Within the span of the last 20 years, we’ve seen three significant market selloffs: the Dot-com bubble, The Great Recession, and the onset of the Covid pandemic, with the S&P 500 bottoming at $775 (Oct ’02), $666 (Mar ’09), $2,191 (Mar ’20).
Where is the S&P 500 today? Even after a market sell off this year, the S&P 500 closed the day at $3,785.2 The moral of the story – the market eventually recovers.
It’s not easy to stick to your guns when markets are down, especially when there doesn’t appear to be a clear end in sight. However, as history has told us time and time again, when you buy for the long-term odds are on our side.
Blog References:
1) Stern NYU: Historical Returns on stocks, Bonds and Bills: 1928-2021 – S&P 500 returns include dividends
2) As of June 30, 2022