


During times of high market valuations and following long-periods of strong market returns, we are often asked where we think the market is “going from here”. The real question behind this inquiry is “is it time to sell?” When markets go up, it’s natural to be excited about the gains, while feeling nervous about giving back those same gains in the next market downturn.
The crux of the question is “can we sell and preserve our gains and buy when things feel normal again?” It’s a simple question of market timing. Can we do it? Or more aptly, can we do it and come out ahead in the process?
It Takes Two
Market timing requires two decisions. In the case of a “hot” market, the decision revolves around when to get out (to avoid market declines) and then when to get back in (to catch market rallies). In practice, the average investor only thinks about “when to get out”. They rarely think about “when to get back in.”
The investors who think about getting back in, often think “it will be obvious” or “I’ll know it when I see it” or “I’ll just wait until things calm down”. Which is brazenly prescient and assumes a level of foresight that would make any investor extraordinarily wealthy. Unfortunately, markets move so quickly, that it compounds the difficultly of when to get back into the market.
Take the following graph for example:
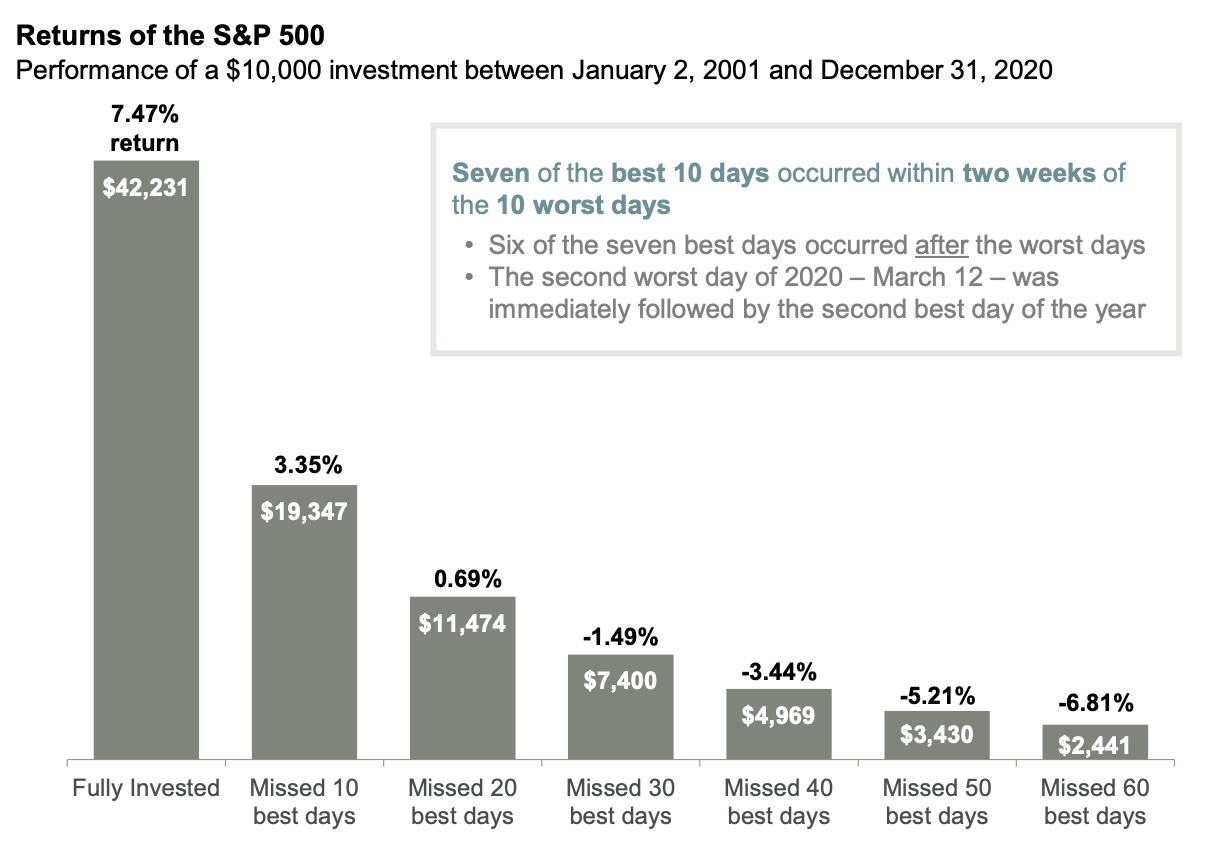
Source: JP Morgan
The graph above illustrates what happened to returns if an investor stayed in the S&P 500 through all boom and bust cycles (going back to 2001) and what happens if they missed the 10, 20, 30, 40, 50 or 60 best days in that period. You can see how your returns are cut in half, if you missed the 10 best days during that period. To be sure, the time period above is for 19 years, or approximately 5,284 trading days since 2001. Which means missing out on 0.19% of the investing days, resulted in missing out on over 55% of the return.
What’s even more interesting, is that 7 of the best 10 days occurred within TWO WEEKS of the 10 worst days. In the end, volatility begets volatility. Markets do not just go down. They go down, then pop back up, then back down and so on. The big down days happen to be around the big up days. What this means is you have to time the bottom almost exactly or you will miss out on a majority of the upside. The likelihood of getting this right, is extraordinarily low.
The following graph paints a similar story for a different time period, the mid-80’s to the mid-10’s. The below study was done on the UK markets and highlights the difference in market value of a $100k invested portfolio over the 20 years, if you miss only the 10 best days:
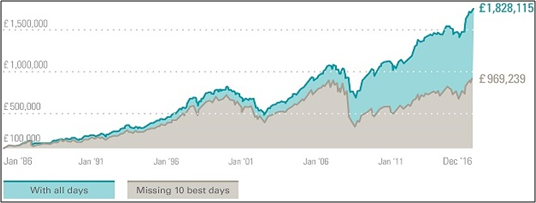
Source: Motilal Oswal
What complicates the decision making process even further is the impact our emotions have on our judgement. Rarely, as investment advisors, do we get calls from clients after the market experiences a deep sell-off asking us to buy more equities in their portfolios. However, when the market is hot, we often get inquiries about allocating more of their investments to stocks. The stock market is the only market where when things go on sale, people run out of the store. It’s also the only market people rush back to after the store has marked prices back-up!
If you’ve been a client of ours for a long period of time, undoubtedly you’ve seen this sketch by Carl Richards of the Behavior Gap before:
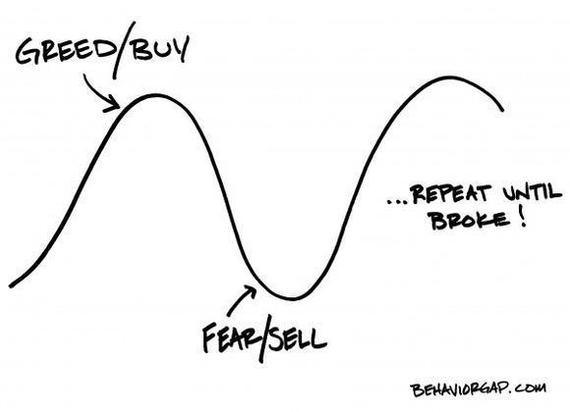
This psychological phenomenon plays itself out, all too often, with countless investors through the market cycles. If you think about it, it is very natural to want to buy something that has performed well (behavioral finance defines this as “recency bias”, where we give more weight to the current trend then we do to historical context).
However, if you think a little more critically and choose to sell what’s doing well, the higher performing assets (in a well-balanced portfolio) and buy the poorer performing assets, we’re reinforcing the age-old adage: sell high, buy low. Much easier said than done in practice, unless you maintain a disciplined rebalancing process.
But, I Can Handle Market Volatility
Market volatility can wreak havoc on the psyche. Take for example the following graph showing Annual Returns compared to Intra-Year Declines. An Intra-Year Decline is the difference between the highest and lowest point in the market during that year. You can see on more than one occasion, where the market does exceedingly well for the calendar year, all the while experiencing significant market downswings. The year 2020 was a perfect example of a strong annual return, with a very dramatic market downswing (due to the onset of the pandemic) of below -30%. In 1987 the market declined over -30%, but was net positive of the year, close to 5%.
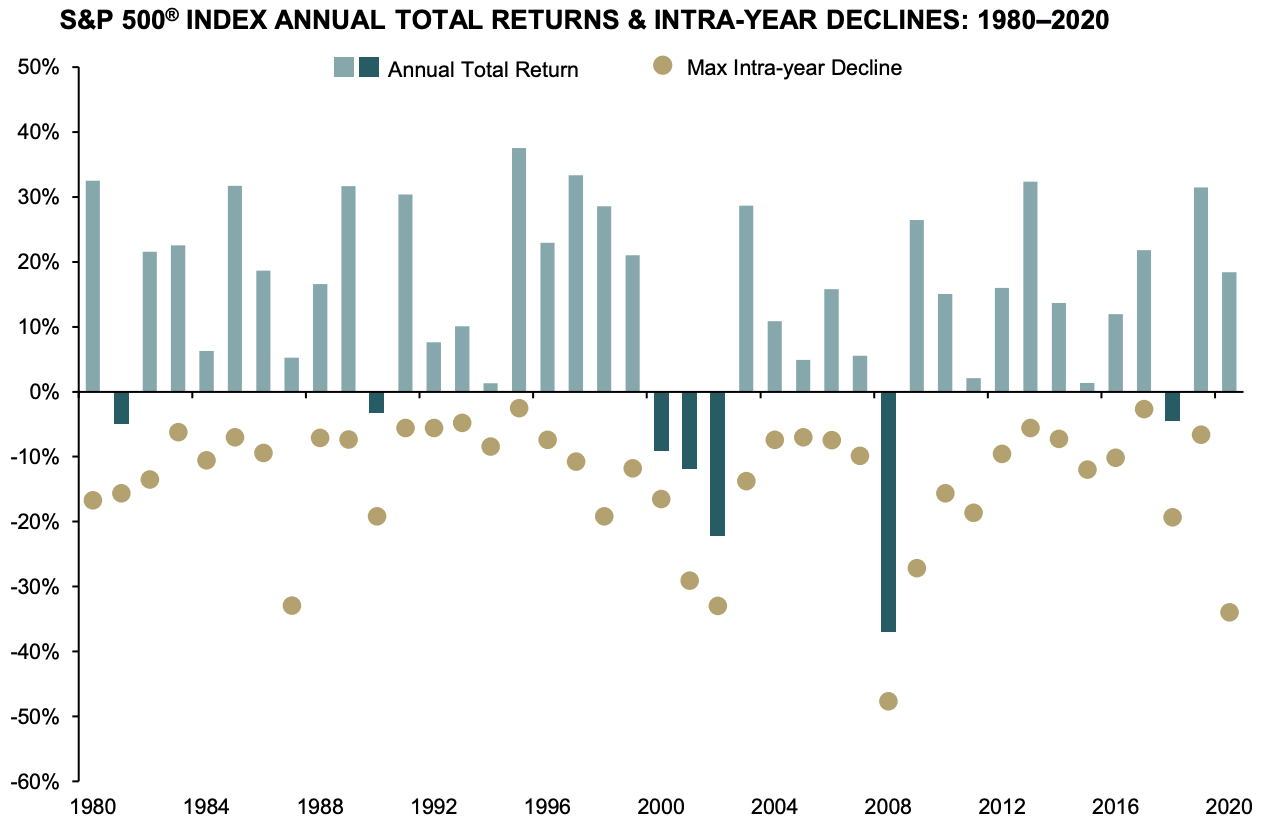
Source: Fidelity
What About What The Experts Are Saying?
Your ability to make the right decision and ride out market volatility gets even tougher, when faced with the never-ending market perspective of the “experts”. Below is a graph showing the start of the year forecast for the S&P 500, represented by the grey bar. You can compare the actual return for the S&P 500 by looking at the blue bar. Notice how rarely the “experts” get it right.
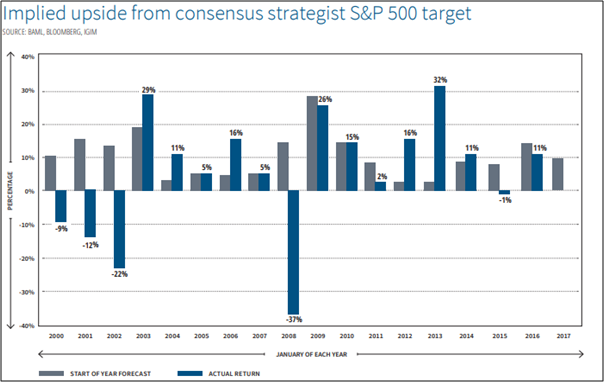
Source: Motilal Oswal
There Is Always A Reason To Sell
The headlines can be unnerving at times. The news focuses on the most sensational items of the day. It is difficult to ignore the doomsday scenarios that play out on a regular basis, across the various media channels. The graphic below does a great job of illustrating some of the scariest reasons to limit our exposure to investments and why its not usually the best idea to react to those headlines. (Click on image to view an expanded graphic)
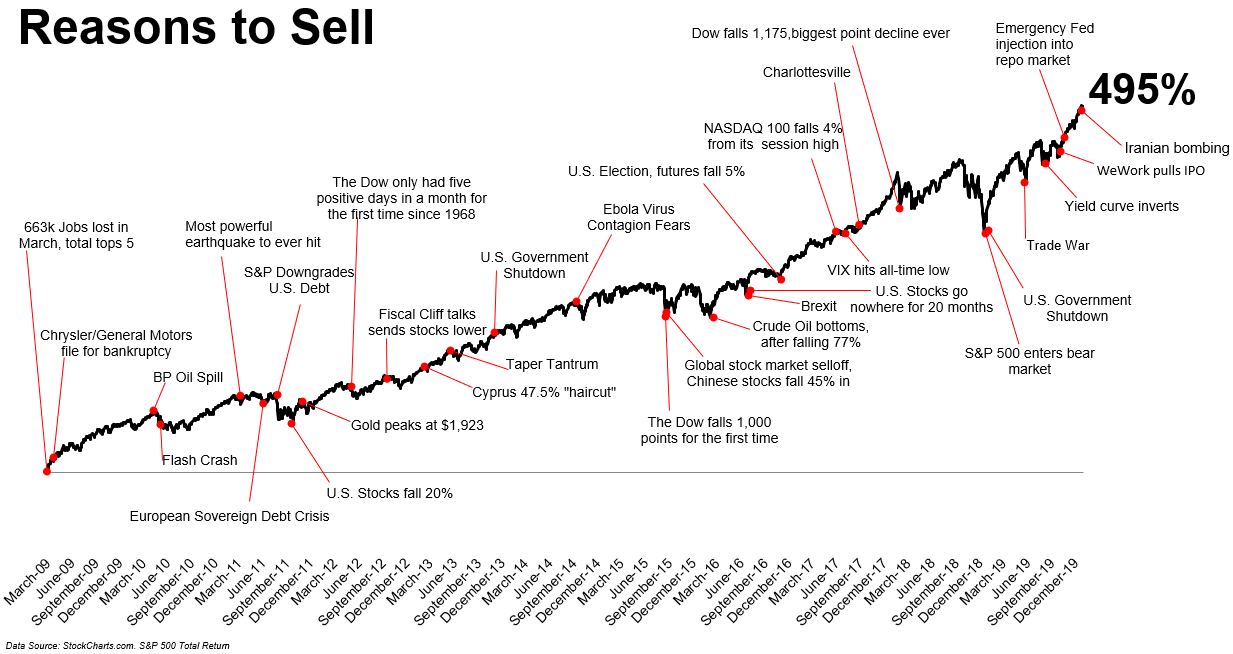
Source: The Irrelevant Investor
What Does It Mean For My Portfolio?
Market valuations can feel disconnected from reality for long-periods of time. Sometimes fundamentals like earnings and cash flow catch-up with market prices. Other times, valuations come down to reflect the fundamentals. What we know is trying to time when market movements will occur is a losing proposition over longer periods. Here are a few things that we do to help clients manage through the volatility and make the most of market downturns:
- Review our goals and financial plan to determine if our long-term risk allocation still fits our current situation. If it does, we sit tight and make no strategic changes to the portfolio during times of unexpected volatility. If our situation has changed, then our portfolio should, as well.
- Rebalance our portfolios on a consistent schedule to reinforce sell-high/buy low. If you want to impress your friends at a cocktail party you can call it “capitalizing on the mean reversion of uncorrelated assets”. Seriously, try it! 🙂
- Increase our exposure to investments that have lower correlations with traditional publicly traded markets, this includes private investments like our Canyon Creek Investment Fund.
- Reinforce the idea that “doing nothing” during periods of uncertainty is actually “an intentional act” of sticking with a long-term investment strategy. After all, a long-term strategy is built to weather short-term volatility, while staying true to our long-term goals.