

Economic Hot Buttons
Blog | Economy | Planning Perspectives | Portfolio Management

Inflation is an economic indicator we discuss heavily with clients during our planning sessions to project future income needs. For years, inflation has been benign, to say the least. Over the last decade, policy makers have been attempting to increase inflation, to ensure it stays close to their preferred target of 2%. Anything lower than their 2% target, risks stagnation in an economy, or worse deflation, which is difficult to manage.
While inflation over the last decade has been well below 2%, for financial planning purposes, we choose to use the 45 year average inflation rate, which is closer to 3.5%. The late 1970’s and early 1980’s highlighted that inflation can be much higher. To account for the possibility of higher inflation in the future, and subsequently higher living costs in retirement, we have deferred to this longer-term average.
As we are experiencing now, inflation is alive and well. Will we see a return to the levels of 40 years ago? Probably not. But, it’s worth exploring the causes and effects of inflation on the economy.
Inflation
Below is a breakdown of the year over year % increase in the Consumer Price Index (CPI), the primary inflation indicator. As of February, we can see significant increases in the primary categories of food and energy, with energy experiencing the biggest increase.

Pushing into March, we are seeing the annualized rate of inflation continues to remain elevated, averaging close to 8%. As you can see in the chart below, this is a significant departure from the inflation rates of the last 10 years.

Despite the Federal Reserves accommodating monetary policy over the last two decades, inflation stayed relatively benign. However, that is changing given the following events;
- Near unprecedented fiscal stimulus to combat the effects of the COVID-19 pandemic
- Supply chain disruptions and supply dislocations coming directly from the effect of the pandemic on the global work-force and its inability to meet consumer demand
- Russia’s war on Ukraine and the subsequent tragic events resulting in (among more significant horrors) a shock to the global energy supply
These events, in combination with the unprecedented expansion of personal, corporate and government credit of the last decade, create a fertile ground for inflation to stay high, if not increase.
Interest Rates
Historically, as inflation takes hold and prices increase, another major economic hot button is often triggered: interest rates increase. When inflation increases, the Federal Reserve adjusts its monetary manage it.
The primary tool “the Fed” will use to combat inflation is to increase the Federal Funds rate. This is the rate that banks charge other banks, when they lend their reserve balances (reserves held at the Fed) to each other. The result of this increase, is a cascading increase in rates down the chain, which lead to higher borrowing costs for everything from homes, cars, to personal lines of credit.
Below you can see the change in mortgage rates in the US, going back to 2019. For a period of time we experienced record low rates on 30 years mortgages, below 3%. Today, we are seeing rates increase to almost 5%. The 30 year mortgage is a decent barometer for all other consumer borrowing costs and signals a potential decline in consumer demand.

A girl works at a computer in a modern office
Below is a chart comparing inflation, the Federal Funds rate and 30 year mortgage rates. You can see the correlation between rising inflation and the delayed effect of increased borrowing costs, due to the increase in the fed funds rate.

Consumer Spending
Increasing inflation and the ensuing increase in interest rates will have economic consequences, generally in the form of lower consumer spending. As a reminder, consumer spending (identified below as “Personal consumption expenditure”) is the primary driver of US economic growth, representing almost 70% of GDP, as the following graph illustrates:

If consumer spending declines, invariably we will see a recession in the US. A recession being defined as two back-to-back quarters of negative US GDP growth. A slowdown in consumer spending doesn’t necessarily indicate a recession, but outright quarterly declines in spending has generally only occurred during recessions.
But Jobs…
Despite these economic headwinds, we are currently seeing unemployment drop to pre-pandemic levels. The labor market added an additional 431,000 jobs in March, bringing the unemployment rate down to 3.6%. Over the last 6 months, the US has added on average 600,000 jobs per month. Which is remarkable, given the near 15% unemployment rate of 2 years ago:

Important service areas of the economy are seeing signs of life with hospitality, retail and construction adding the most jobs. While wages have increased over the last year, they have not been able to keep up with the pace of inflation. It remains unclear if higher employment will offset the effect of higher interest rates on overall consumer demand.
What Does It Mean For My Portfolio?
It means market volatility ahead. In the coming months the market will likely be swinging back and forth on new inflation numbers, interest rate moves by the Fed, changes in consumer spending and the overall strength of the labor market. If job growth stays strong, then we could see milder volatility and more optimistic outlooks. However, if inflation stays high or goes higher, the Fed may have no choice, but to pump the breaks with bigger interest rate hikes, resulting in slower future expected growth. Remember, the market is always forward looking. It’s not pricing in what has happened or what is happening now, it is attempting to price in what will happen in the future.
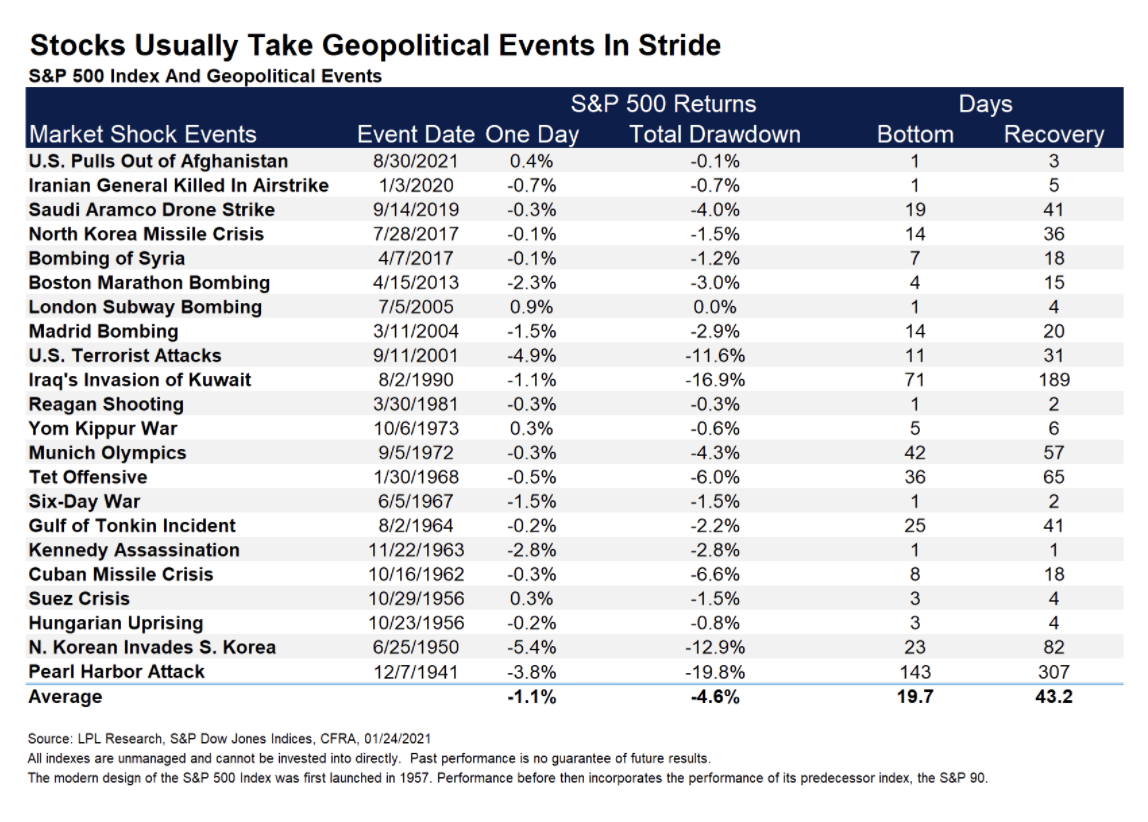
Please refer to our last update titled “Market Timing? Why Not Try?” which has been posted to our Bear Mountain Capital blog, regarding why it’s difficult to successfully move in and out of the market, even when volatility is expected. In the meantime, check out the final two graphs, showing how the US stock market generally performs after a rate hike and following major geopolitical events:

